

[This is part of BFNow Self-Study Module 4: Systems & Habits. For more about the overall Self-Study program, please look at About BFNow Self-Study and BFNow Self-Study Orientation.]
If you haven’t done so already, let me encourage you to pause, relax and release, perhaps with a big stretch or three deep breaths.
The goal of this lesson is for you to get a stronger awareness of the role that thresholds play in systems.
Thresholds
I’ll be using thresholds and tipping points synonymously here although threshold is likely the more general term. They both refer to a place where the behavior of a system changes categorically. They are the dividing line between system domains, to use the term I introduced in What Time Is It – Part 1.
Some examples might help. Let’s start with the classic one I used in Systems Literacy – Part 3 as illustrated in this quick video.
We might diagram this system like this:
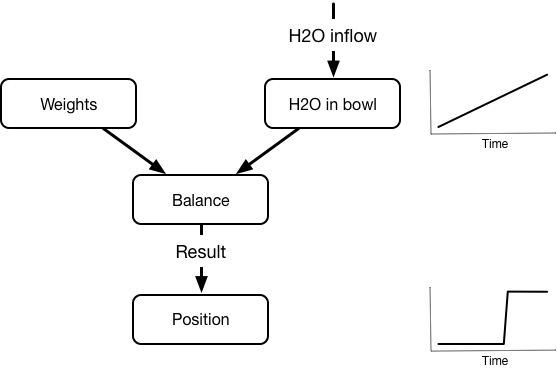
The diagram shows the structure of the system. The small graphs on the right show how some of the properties of the system change over the course of the video – the amount of water in the bowl in the upper right and the height of the left side of the balance in the lower right.
The “threshold” part of this system comes from Balance which converts the smooth increase in the amount of H2O in the bowl (a slider type input) to a categorical change from left down to left up. (Notice that in practice the change takes a little time. There is a finite transition between the two categorical states – more of a tipping zone than a tipping point.)
By the way, if we were to represent this mathematically, then Balance would contain something like:
IF(Weights > H2O in bowl) THEN 0 ELSE 1
Thresholds are often represented by such if statements based on inequalities.
When output is smoothly proportional to input, the relationship between output and input is described as linear – that is, if you graph output vs input you get a smooth (often straight) line. Thresholds break this smooth relationship, and systems with thresholds are known as nonlinear.
Here are some other examples of territories where thresholds play an important role:
Imagine water starting to form a drop at the end of, say, a faucet. At first the water clings to the faucet. The drop gets smoothly bigger as water is added to the drop, still clinging to the faucet. At some point, however, a tiny bit of additional water causes the drop to break away and fall. The point where that happens is a threshold.
Blood sugar level has three zones. In the middle zone, the blood sugar is used in real time by the body’s cells. In the upper zone, insulin kicks in and some of the blood sugar gets stored as fat. In the lower zone, glucagon acts to convert fat back into blood sugar. The boundaries between these three zones are thresholds.
The summer day has been warm and humid. As evening comes, the air cools and water droplets begins to form on leaves and grass. The temperature where that happens is known as the dew point and it is a threshold.
The level in a car’s gas tank goes up when it’s filled at the pump and then goes down as you drive. The engine runs just as well when when the tank is 100% full or when it is only 10% full. However, if the tank goes to 0% full, the engine stops. An empty gas tank is a fairly dramatic threshold.
Let’s look at the blood sugar example in more detail to see how crossing a threshold can make a big difference in outcome. Here are a pair of schematic graphs showing blood sugar levels vs time for two different foods. The idea is that the total amount of carbohydrate is the same in both but one gets absorbed slowly (e.g. many types of vegetables) while the other gets absorbed fast (e.g. refined sugar).
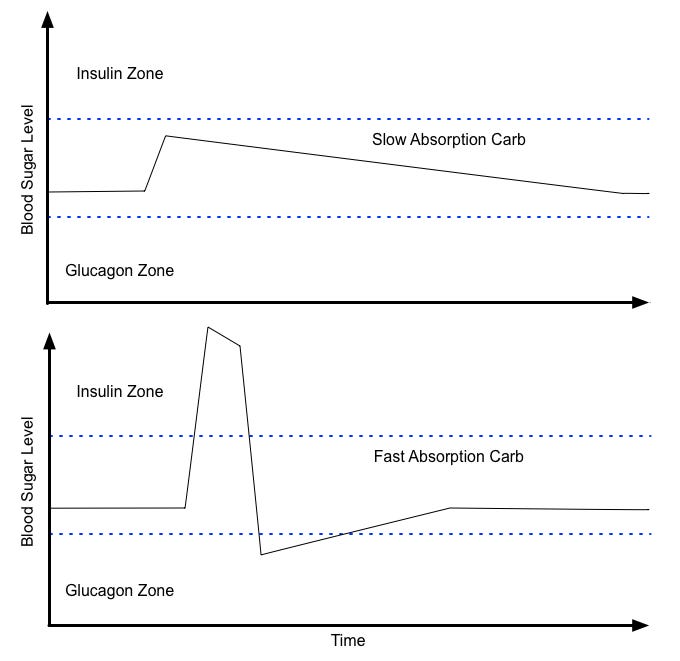
In the slow case, the blood sugar level stays in the middle zone and all of the blood sugar gets used by cells in the present.
In the fast case, the blood sugar goes up into the Insulin Zone, so some of it gets converted to fat and stored. Blood sugar spikes like this tend to overshoot on the way down, but the net effect is to increase body fat. Same total amount of carbohydrate; different timeframes and different outcome because of crossing the thresholds.
Finally, here’s an example where the thresholds aren’t sharp but there are still domains worth distinguishing:
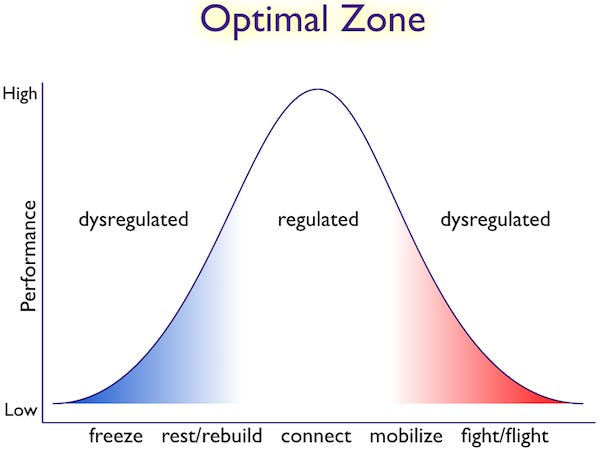
When you get triggered, either toward fight/flight or toward freeze, it often feels like a categorical shift.
Natural territories are full of thresholds and corresponding domains. If our systems are to accurately map these territories, we need to pay attention to and include these features. Identifying thresholds in systems can be a huge source of insight.
Experientials
Start these in the morning, let ideas come to you throughout the day and then return to it in the evening.
Find places in your system diagram where there may be thresholds. For example, sometimes Context and Cue actually lead to Routine and sometimes not. For the qualitative systems we’re working with, it won’t be always clear, but if you think there might be a threshold in some part of your system, there probably is, so just describe what you are thinking. Make a list of all the thresholds you think might be in your system and/or note them on your diagram.
Pick one threshold and make a pair of system diagrams (i.e. print out copies or duplicate your existing diagram) that show the behavior on each side of the threshold (i.e. the behavior for each system domain). Add descriptions/notes that help to clarify the character and implications of this threshold.Using the habit diagram as an example, what happens when the Cue isn’t strong enough to initiate the Routine? What happens when it is? If you have Other Consequences that counteract the Reward, what is the tipping point between their two influences on the Cue. Is there anything you could do to shift this tipping point to get more of the results you want? (Either strengthen the habit or diminish it.) How does the Context affect initiating the Routine? Would the same level of Cue get over the threshold with one Context but not with another? What’s different about those Contexts? Could you modify the Context to get more of the result you want?
By now you are likely accumulating a number of versions of your system diagram. You can think of these as layers, each with its own set of insight into your territory.
We’ll continue to build and evolve these diagrams throughout the module.
Thanks,
Robert
[Link back to the Module 4: Systems & Habits Overview page.]