

[This is part of BFNow Self-Study Module 4: Systems & Habits. For more about the overall Self-Study program, please look at About BFNow Self-Study and BFNow Self-Study Orientation.]
If you haven’t done so already, let me encourage you to pause, relax and release, perhaps with a big stretch or three deep breaths.
The goal of this lesson is for you to get a stronger awareness of the roles that time plays in systems.
Time in systems
The usual system diagram shows structure; that is, it shows the flow of influence from one part to another. What isn’t shown is how fast that influence flows. Let’s look at a simple version of the habits diagram:
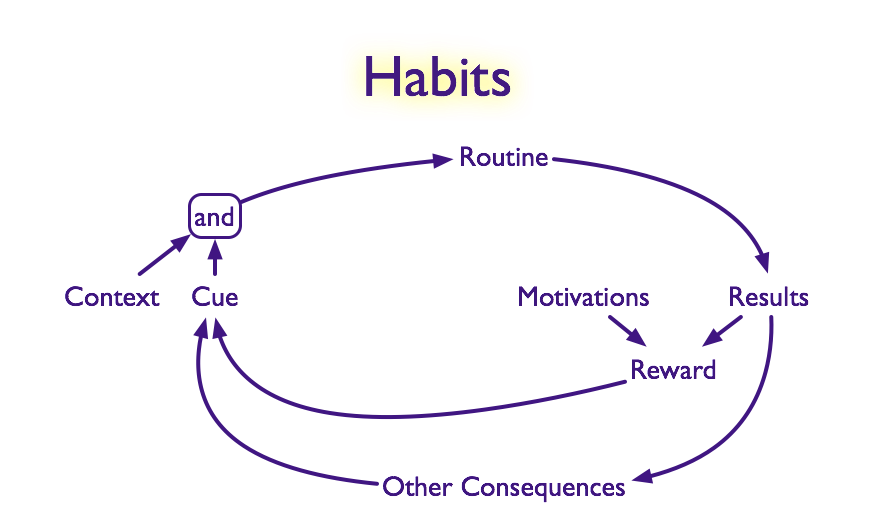
The diagram doesn’t tell you anything about how much time it takes
from seeing the Cue to doing the Routine
from doing the Routine to getting Results
from getting Results to feeling the Reward
from getting Results to Other Consequences
from getting Results to reinforcing the Cue
In simple cases the timing may not matter, but it gets interesting when there are different time scales in the system. Suppose the habit concerns eating some food that you enjoy but that causes problems of some kind. Eating and food have a lot of time scales:
As soon as you start thinking about the food, you body starts to respond with saliva and other preparatory changes.
When you are chewing, taste and smell give you an instant direct association with the food.
Also when you are chewing, some of the food may get absorbed into your bloodstream with whatever quick effects that may have.
When the food reaches the stomach, there is more selective absorption.
It takes about six to eight hours for food to pass through the stomach and small intestine, with new selective absorption and effects.
Average transit time through the large intestine is about 40 hours, with yet more selective absorption and effects.
What’s absorbed gets used in the body, where it may stay for years.
Each one of these creates a different set of Results, Rewards and/or Other Consequences. Many of these involve time lags, that is, there’s a space of time between the initial action (e.g. eating) and the Results (e.g. food reactions that only show up once the food reaches the large intestine). They also involve different time scales, that is, chewing happens in a few minutes, digestion requires 10’s of hours, use in the body extends over years.
We more easily associate things that happen close to each other in time. Unless you make a conscious effort to connect the later or slower consequences, they aren’t likely to have much influence on the Cue.
This leads to the main strategy for the day: Pick the consequences that you want to have a big influence on the Cue and strengthen their visibility. One common way to do this is to create a graph, diary or calendar that give you an instant visual for events that unfold slowly.
I have a personal example that I’d like to share. Let me start by saying, this is my way and doesn’t need to be your way, but it’s the best I have at the moment to illustrate using a graph to bring slow change into the immediate present.
In December 2015, I decided I wanted to make some changes in my habits around eating, including the impact on my weight. I got a scale that measures percent body fat as well as overall weight so I could distinguish between lean mass and fat mass. I put together a spreadsheet with a graph that allowed me to track the slow changes in weight. This is five month’s worth:
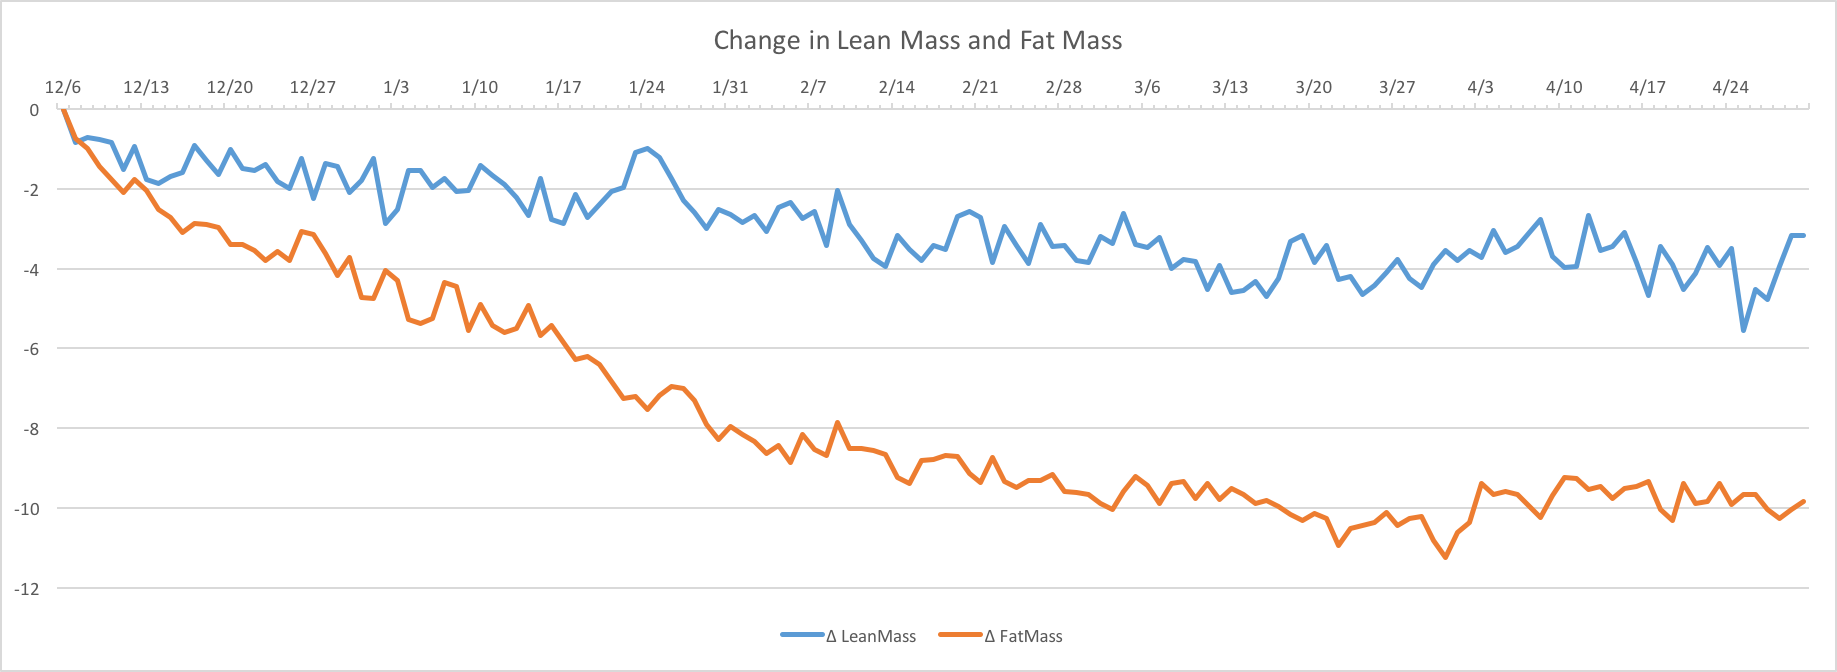
You can see the overall trend but there’s a lot of up and down from day to day. Some of this is noise from the percent body fat measurements, which aren’t exact. Other places reflect changes in my diet (like the bump for Christmas around 12/24) or my level of exercise or hydration.
This graph is my self-chosen coach. As I go through the day deciding what and how much to eat, how much water to drink and how much to exercise, I know the consequences of my choices will show up in trend over the next few days.
The point is not the specifics, which might not work for you, but rather to find some way to bring slow change into your immediate awareness – and not get misled by day-to-day noise.
Reinforcing and balancing feedback
Above, I talked about feedback from the system to you. There is another kind of feedback that is usually more associated with systems, namely feedback within the system. Let’s look again at the habits diagram:
The sequence that goes Cue > Routine > Results > Reward > Cue is what, in system terms, is normally called a feedback loop. The flow of influences ends up at the same place where it started.
This can seem puzzling, if not impossible. How can the Cue cause itself? But that’s not the way to interpret what’s going on in this diagram. The word “Cue” actually stands for a whole series of events, separated in time but having the same position in the structure. We should re-write the sequence as Earlier Cue > Routine > Results > Reward > Later Cue so the Earlier Cue sets off a series of events (with time delays) that re-inforce the Later Cue.
Feedback loops like this, that come back to the same place in the structure but at a later time, are usually categorized as reinforcing (positive) or balancing (negative). The loop that includes Reward is likely a reinforcing loop, meaning that increasing the Reward strengthens the Cue. The loop that includes Other Consequences may well be a balancing loop, meaning that the stronger the Other Consequences (if they are unwelcome) the more the Cue is diminished. Reinforcing loops by themselves can lead to runaway exponential growth. Balancing loops counteract that growth. Working together, they can lead to stability. Systems with loops that reflect real territories always have some combination of reinforcing and balancing. BTW, “positive” and “negative” aren’t judgments here. Interpret them in a purely mathematical sense.
Experientials
Start these in the morning, let ideas come to you throughout the day and then return to it in the evening.
Find a place in your system diagram where different time scales may play a role. The Results and Other Consequences parts of the habits diagram are good examples. Make a list of all the different time scales that apply to that part of the system.
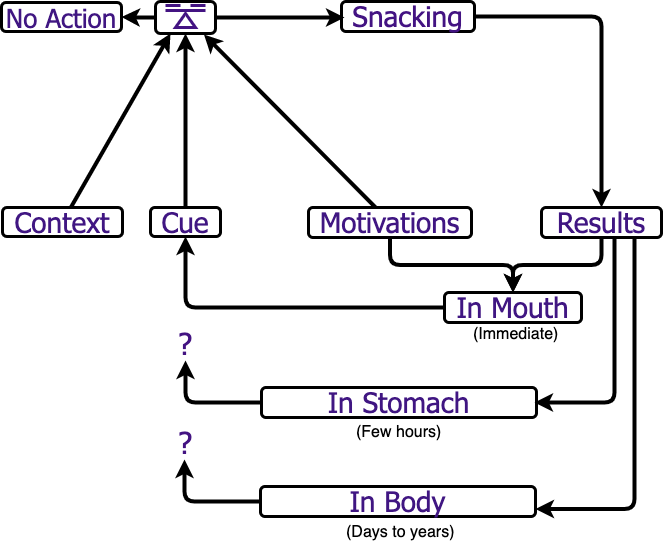
Pick multiple time scales from your list. (Using the food example, these could be “in mouth,” “in stomach” and “in body” – see simplified example below.) Expand your diagram to reflect these different time scales and add descriptions for what’s going on at each time scale. Are there any time lags? How could you increase the influences of the longer time scales?
Are there any loops in your diagram? Are they reinforcing or balancing? If you think a particular loop might be sometimes reinforcing and sometimes balancing, what are the conditions that lead to one or the other? Add notes to your diagrams.
We’ll continue to build and evolve these diagrams throughout the module.
Thanks,
Robert
[Link back to the Module 4: Systems & Habits Overview page.]
Expanded habits diagram for snacking as an example:
On your diagram, find some way to connect the slower timescales back into the Cue or the Context so those Other Consequences can influence the habit.
If you are working with a system other than food habits, do something analogous that brings slower timescales into the system in a way that gives them meaningful influence.